Tactile Maps opening up the world of neurodiversity for the visually impaired
12/8/25

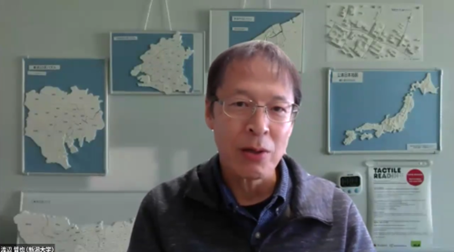
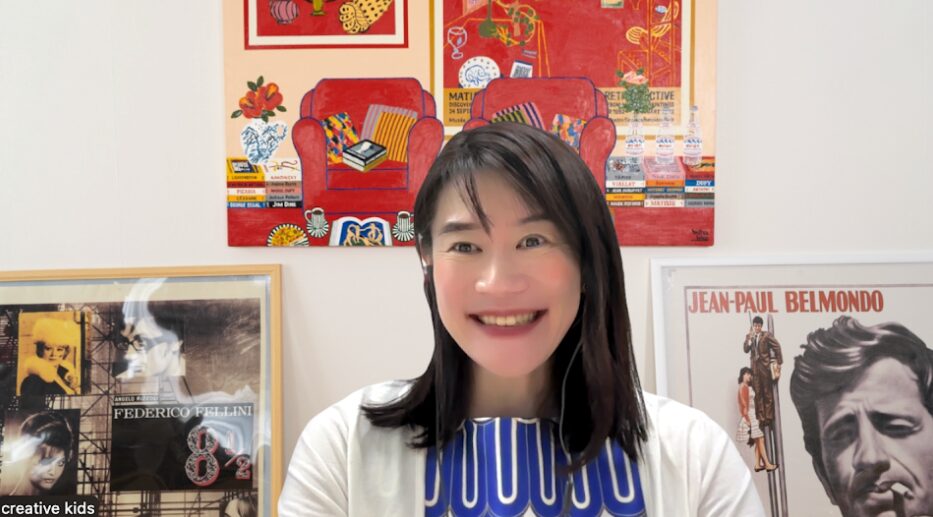
The Neurodiversity Project, sponsored by B Lab, aims to realize a society in which the diversity of the brain and nervous system is respected and everyone can demonstrate their abilities in their own way. In this Neurodiversity Project interview series, we introduce the efforts of Dr. Tetsuya Watanabe (▲Photo 1▲), Professor, Faculty of Engineering, Niigata University. The Watanabe’s laboratory has been researching and developing a “tactile map” that enables visually impaired people to check routes to their destinations by touching them, and exhibited it at “Minna no Brain World” (Brain World for Everyone). Nanako Ishido (▲Photo 2▲), director of the B Lab, spoke with us about the background of their work on tactile maps, the specifics of their research, and future prospects.
> Interview videos are also available!
Tactile maps for the visually impaired
Research has been undertaken for more than 10 years
Ishido: “The Watanabe Laboratory of the Faculty of Engineering at Niigata University is working on a “tactile map (shokuchizu)” that uses ICT to assist the visually impaired. This time, they were also introduced in “Minna no Brain World”. Could you tell us again about the contents of the exhibit and your research?”
Dr. Watanabe: “The Watanabe Laboratory has been working on “tactile maps” for more than 10 years. We do not expect many visually impaired people to visit “Brain World for Everyone,” but that is why we thought it would be meaningful to let people who are not usually involved with visually impaired people know that there is such a thing as a tactile map.
I originally became involved in tactile map research after meeting people overseas who were working on tactile maps just before I was appointed to Niigata University and being very surprised. In fact, tactile maps for the visually impaired have been produced for many years, even a hundred or two hundred years ago. However, since they are very time-consuming to make, it is difficult to produce maps that meet the detailed needs of the visually impaired users, and most of them were general-purpose maps.
However, what I saw just before my assignment at Niigata University was a system for creating a manuscript, so to speak, for printing a map automatically touched by a Braille printer. When an address was entered on a road map, the name of the road and the location of the address were indicated, and the Braille printer could print the map as it was. Moreover, the person who developed the system was visually impaired. I visited the developer’s laboratory and had a chance to talk with him.
A few years later, I received outside funding to work on a research project on the theme of “making easy-to-understand maps,” and one of the maps I worked on was a map. The system was a 3D copying system that created an image of surrounding roads by inputting addresses based on data from the Geospatial Information Authority of Japan, printed it on special paper, and put it through a 3D copying machine to create a map that could be touched. I myself was the group leader, and the members created the program.
When we created tactile maps with the 3D copy system and introduced them at events for the visually impaired and at workshops we held on our own initiative, many people responded, “That’s interesting. People who came to our events and workshops often asked us, “Can you make a map of the area around my house? I tried to input the address on the spot so they could actually touch it, but the first thing they could do was just street lines, so they didn’t seem to understand what was going on. So I said, ‘Your house is here. Then, we started to input landmarks such as ‘Your house is here, and there is a road here, and if you go in this direction, you will find a park. The people with audiovisual disabilities were really happy because they had never thought they would be able to get their own “touch map,” and we were able to witness their joy. This encouraged us so much that we decided to continue this research for a long time, and we have continued it to the present.
However, when we consider whether we have been able to deliver “tactile maps” to those who really need them just by presenting them at exhibitions, workshops, and academic conferences, it is by no means the case. We have continued to make tactile maps for visitors to the event, but it is still a “once-a-year thing. In addition, we have been practicing various other activities, such as holding tactile map events in our laboratory and developing a service to create tactile maps by accepting applications via e-mail.
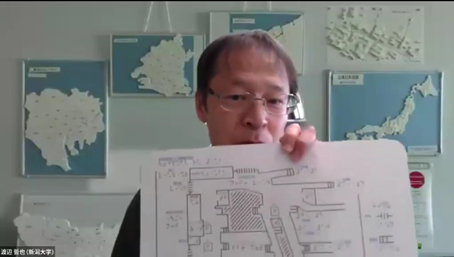
How have we actually created tactile maps? Here is a three-dimensional copy diagram. (▲Photo 3▲)
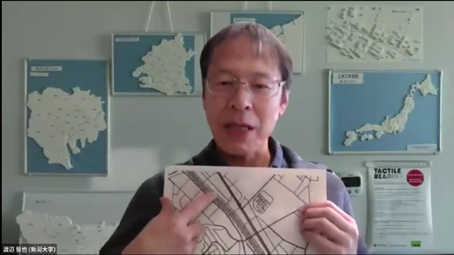
When you put this 3D copy of the drawing through a 3D copy machine, all the black areas will rise to a height of about 0.4 to 0.5 mm and become touchable.”
Ishido: “I feel that tactile maps are a very interesting research theme. For people who do not have visual impairments, or so-called “clear-sighted people,” it can be said that they can have a “map with information added by a new sense, the sense of touch. Could you tell us more about the information that can be conveyed only with the sense of touch, and how you incorporate the unique characteristics of the sense of touch, which are different from those of sight, into your design philosophy?”
Dr. Watanabe: “Not only maps, but understanding a diagram by touching it is more difficult than understanding it visually. Since the resolution of a finger is considered to be 2 to 3 mm, it is possible to distinguish two dots that are 2 to 3 mm apart when touched with a fingertip, but two dots that are only about 1 mm apart may be perceived as one dot. This is believed to be the reason why people with acquired visual impairment find it difficult to read Braille. In addition, anyone can trace something with a finger and feel that something is there, but it takes training to recognize what is traced as a whole shape.
In addition, as is related to resolution, it is difficult to perceive detailed shapes with the sense of touch. If elements are attached to each other, it may not be possible to accurately grasp them, so the map must be larger than a visual map, and the space between elements and points must be properly spaced. In addition, the number of map symbols cannot be too large, and there are many other restrictions and limitations.
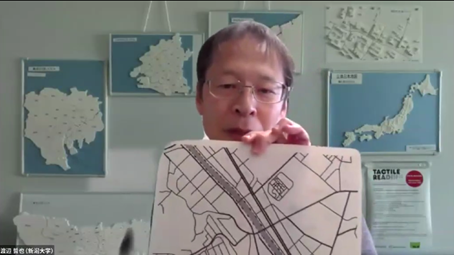
Even in this three-dimensional copy figure I made for reference, the information is a bit packed. In reality, it may be difficult to grasp the whole picture by tracing with a finger unless each block is enlarged by one or two centimeters.” (▲Photo 4▲)
Maps are not just for walking around town.
It’s a way for everyone to get a bird’s eye view and “think about the big picture.”
Ishido: “I could understand that you are making various efforts to improve the accuracy of recognition. On the other hand, I also feel that the visually impaired may have different characteristics from those with clear vision in terms of how they perceive the world and space in their daily lives. From such a perspective, I suspect that there may be a way to create maps that are more in tune with the way visually impaired people perceive the world. I assume that you are actually promoting your efforts through dialogue with visually impaired people, but I would like to know your thoughts on this point.”
Dr. Watanabe: “In terms of the differences in perception of the world and space between visually impaired people and people with clear vision, and how any of these differences are reflected in maps, I don’t think they are directly reflected in maps. A map is a bird’s-eye view, like looking at the sky from above, but when a human being is walking around town, for example, he or she is not picturing a bird’s-eye view of the map from above his or her head. They are moving within their sense of what is in front of them that they can see, and what is to their right or left. When I first started working on this research, a person who often participated in my experiments said exactly that, ‘That’s how I see the map,’ which I thought was very interesting.
If you were to ‘create a map of the image of yourself being in the city,’ it might be better to reproduce an acoustic map rather than a flat map. But that would be localized. Neither the visually impaired nor the sighted always move with a map in mind, but if they have a rough idea of the map in their minds, they can think, “I’m in this area,” “I’m going in this direction,” “The distance is about ◌◌◌,” and “Then there is a place about here ◌◌◌. Then you can have a bird’s eye view of the area, and move around with peace of mind. That is one of the roles of maps in my opinion.
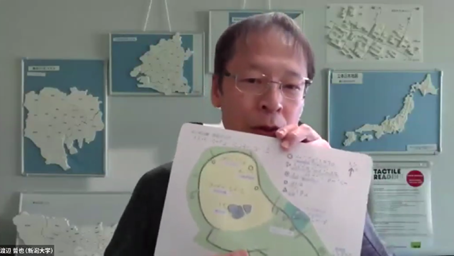
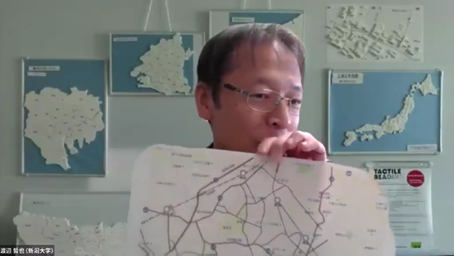
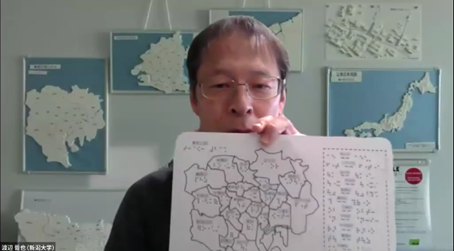
I am not a map expert, but in English, “to map” can mean “to draw a map,” and it can also be used in the sense of “to make a plan by thinking about what to do in the future.” Maps are a means of thinking about a wide area from a bird’s-eye view, and are not necessarily used only for walking in a certain area of a city. At first, I too thought that maps for the visually impaired were maps for walking. However, as we began to provide tactile map services, we found that there was demand not only for road maps, but also for maps of station premises, floor maps of department stores (▲Photo 5▲), park guide maps (▲Photo 6▲), and maps showing where shopping centers are located within a wider living area for use when traveling by car (▲Photo 7▲). When we held events, we received many requests from visually impaired people for maps of the 23 wards of Tokyo (▲Photo 8▲) and maps showing prefectures (▲Photo 9▲). We felt that many people wanted to gain an overall understanding of a wider area, rather than using maps only for walking.
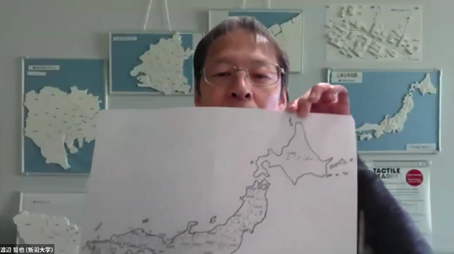
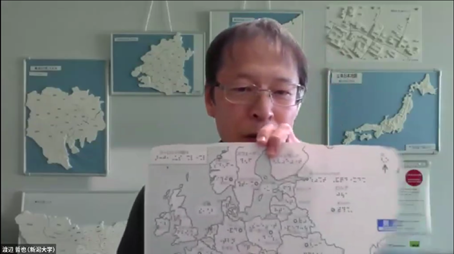
The map I showed you is a map of Japan, but if you can make something like this, you will want a map of the world, too, won’t you? So we made a map of Europe. We don’t necessarily walk around Europe, but we think these maps will be useful in stimulating and satisfying curiosity and interest in learning about Europe.” (▲Photo 10▲)
Ishido: “At the beginning, you mentioned that you can create individually optimized maps by entering an address, and I feel that as technologies such as AI, 3D printers, and smart devices evolve, the way in which individually optimized information is provided will continue to expand. How do you think these technological developments will change the world of tactile maps in the future? We would love to hear your views.”
Dr. Watanabe: “The technological evolution over the past few years has been remarkable, and devices such as AI and GPS have become smaller and more sophisticated. Devices that would have been a pipe dream in the past, such as devices that can detect traffic signals and intersections while capturing images, can tell which direction people are coming from, and can vibrate to let you know which direction to go at intersections, are now appearing one after another.
One of the questions we often receive is, “Don’t you need a map anymore? Some people are fine with just getting to their destination using a navigation app that leads them there, while others may forget how far it is from their current location or their original purpose while looking at the map, and enjoy the experience of looking at the map. Some people may forget their original purpose while looking at the map and enjoy looking at the map itself.
Similarly, there are people with visual impairments who want to know what their destination is like, people who don’t care, and people who enjoy maps. In that sense, the role of tactile maps will not disappear. Rather, if people can use tactile maps to understand their location and destination in advance, and then utilize the latest devices, they will be able to more confidently say, “I have walked this far, so I should be there soon.
Also, some devices may not yet be able to fully support indoor use. For example, some train stations have interior maps, but getting to the location where the map is posted is another challenge. In the case of outdoor maps for the visually impaired, some people may feel uncomfortable tracing them with their hands because they are dirty. For these reasons, there is a need to know in advance with a tactile map. In that sense, I believe that paper maps, including tactile maps, will always have a role to play.”
Sight provides a lot of information at a glance
Tactile senses can confirm detailed information that visual senses miss.
Ishido: “We at the Neurodiversity Project place importance on both individual expansion through the use of technology and environmental adjustment on the social side. From the perspective of environmental adjustment, various designs in society have been built around the so-called “majority” of people. However, by utilizing technology, we can create a new environment that can also accommodate the problems of those who have been considered a minority. We believe that this will lead to a society that is easier to live in for many people, including those who have been forced to conform to the majority who are different from themselves. Although each person is different, the way information is provided has long been designed to be visually oriented. In your involvement in the research and development of tactile maps, have you ever sensed such a social bias? At the same time, I would like to hear your thoughts on how technological research on haptic information and its transmission by touch can rethink the visually-centered society we have come to take for granted.”
Dr. Watanabe: “Vision is good for quickly capturing broad information. On the other hand, tactile sensation is all about touch, which is a time-consuming sensation compared to vision.
However, visual perception sometimes misses detailed information. Even if you think you know what you are looking at at a glance, when you check it out with the sense of touch, which takes time, you may find yourself saying, “Hey, this is what it looks like here. Even a road that you pass by in a short time by car without seeing much of the scenery, you may see something new if you take the time to ride a bicycle or walk along it. Both have their good points and bad points. From that point of view, tactile sensation is a sense that allows you to notice details because it takes time.”
Ishido: “We, too, are promoting initiatives that utilize technology to enable people to experience a variety of senses. When I heard about the tactile map, I was reminded once again that this research is of great significance not only to the visually impaired but also to many other people because it enables us to notice information that cannot be noticed by sight alone. Visitors to “Brain World for Everyone” are not necessarily limited to the visually impaired. I believe it will also provide an opportunity for people with clear-sighted eyes to become aware of aspects of the world that they would miss if they only used their eyesight, and lead to an experience that expands their own senses. If you have any feedback or impressive episodes from such perspectives, please let us know.”
Dr. Watanabe: “You are right. What I have been focusing on this year is exactly to appeal not only to the visually impaired, but also to other people. I would like to spread the word more about the flat maps and the 3D printers that we have made.
In that sense, this “Brain World for Everyone” was a very good opportunity. When I think about how tactile maps can be useful for visually impaired people, for example, they can help them understand the size and shape of certain wards in Tokyo and Osaka, whether they are jagged or smooth, and other things that are not obvious just by looking at them. Especially when you pick up a puzzle in your hand, you can feel how big it is.
For example, when asked, “Which prefecture is the second largest prefecture in Japan after Hokkaido?” few people would be able to remember by knowledge, but at a recent event, by actually touching the prefecture, people said, “Iwate Prefecture is this big? Even for those with clear vision, it is easier to understand what you have seen with your eyes and what you have not paid attention to when you touch it. If visitors to “Brain World for Everyone” find such things interesting, I think tactile maps and their implications will expand even further.”
Tactile maps as a “bridge” between the visually impaired and
bridge” between the visually impaired and the sighted
Ishido: “I felt that the experience gained by touching rather than looking at information has the potential to change the way we perceive the world and deepen our understanding of it. We have strong expectations for its great potential. On the other hand, how widespread are tactile maps today? And what do you think are the bottlenecks for further expansion? For example, what factors, such as institutional issues, cultural demands, and technological hurdles, could hinder the spread of tactile maps?”
Dr. Watanabe: “3D printer’s and paper tactile maps are a little different. I also feel that there is a division between what many people want and what only a few people want. For example, most people, both the visually impaired and the general public, are interested in a map of Japan. If many people want a map, we can sell it and spread the word, but what do we do with something that does not sell to many people, something that has the needs of a specific group of people? I believe that the important point is not to let the visually impaired remain in the world of only those who are visually impaired.
There is another type of mapping that is not as numerous, but is more tailored to individual needs. For example, a map between a certain station and a certain address would only be wanted by the people who live there. For such a map, we provide individualized services. We have been making maps for some time, but sometimes we make them together with visitors at the event, or we hold a “tactile map making session” and ask them to find the address on the map and then ask, “Is this the area around here? What kind of stores would you like to put in the surrounding area, and how large an area do you want the map to cover?
We accept about 5 people at a time in our tactile map making group. The group consists of myself, students, and others who are interested in making a tactile map. The meeting is a lot of fun. In fact, it is a very enjoyable process for both the visually impaired person and the person making the map beside him or her, as they gradually come to understand what they did not understand at first, and witness the joy of the visually impaired person. Moreover, since there is language exchange, the visually impaired often discover things they didn’t know existed there while looking at the map and talking to the person with disabilities. This process itself is an opportunity to learn about the community, and I think it is a very meaningful meeting. I initiate these events and hold them mainly in Tokyo and Kobe, where I know people. This year, I would like to increase the number of people who agree with these efforts and promote the spread of such activities.
If there is a bottleneck in this regard, it is that while 3D printers are becoming less expensive, the machines that ultimately raise the map lines remain expensive. I am wondering if this is something that can be done. If these machines become inexpensive, they will become more widely used. 100,000 yen or 300,000 yen machines can be raised through crowdfunding and used for several years.”
Ishido: “I found what you just said very wonderful. Not only visually impaired people, but also local children and the general public can have the experience of making maps as part of their community learning, and the output will also help visually impaired people. I think it would be wonderful if such a cycle could be created.
In “Brain World for Everyone,” based on the premise that each person has different characteristics and sees the world differently, we are using VR and other technologies to experience “how the world looks to other people,” to deepen understanding of others, and to increase tolerance. In this sense, I believe that technologies such as tactile maps can serve as a bridge for people with and without visual impairments to experience the world of others. What are your thoughts on this kind of “mutual understanding through the senses?”
Dr. Watanabe: “We want them to be a bridge, but there are still difficulties. Because, after all, people who can see normally ‘see’. They can enter an environment that relies on the sense of touch like people who cannot see with their eyes closed, but even if they touch for a while, they open their eyes and say, ‘I still don’t understand,’ and then they say, ‘Oh, so that’s how it is. It is difficult to reach a deep understanding of the visually impaired. We may need some kind of mechanism, such as an entertainment program called “Dialogue in the Dark.”
Ishido: “The Dialogue Diversity Museum “Dialogue Forest” also participated in this year’s “Brain World for Everyone,” and I believe that many people were able to experience this event.
I mentioned earlier that vision tends to be the main source of information, but I am very interested in how designs that incorporate various senses, such as touch, hearing, and smell, should be integrated into the social infrastructure. I would very much like to hear your thoughts on how we should utilize senses other than sight in information infrastructure and urban design to realize a society where people with disabilities can live together.”
Dr. Watanabe: “I mentioned earlier about the map-making group. Similarly, I once held a ‘hazard map making group’ with the welfare association for the visually impaired in Niigata City. Several people from the Disaster Prevention Association came to observe the event. Nowadays, I believe that hazard maps by ear are much more widespread, but what you hear by ear is inevitably in chronological order. In terms of whether you are looking at the map from above or you are in the middle of it, listening by ear is a type of immersion. It is sequential, as in, “How far do I have to walk before I can go to the right?
In contrast, a tactile map is a bird’s-eye view from above. It is possible to get a rough idea of how far away it is and in which direction. This is a good point. In the “Hazard Map Making Group,” several visually impaired people, supporters, and members of the Disaster Prevention Association joined us to make a map between their own homes and the nearest evacuation centers. The participants touched the map together, and the visually impaired participants talked with the visually impaired participants, saying things like, “This is where you are,” or “There is a ◌◌ on the corner,” to understand the evacuation route and other information. After that meeting is over, they can actually walk around once and see how long it takes them to get there. That is the ideal way to spread the word.
In terms of infrastructure, for example, each municipality has a system in place that provides audio directions to city hall and the nearest train station. We are considering the possibility of incorporating tactile maps into such services for the visually impaired. Although they may not visit city hall or ward offices every week, it would be wonderful if city halls and ward offices could provide tactile maps of frequently visited places in the community, the entire city, stations, and other major locations in the city.”
Based on technological progress and individual optimization
What is an inclusive map?
Ishido: “You mentioned hazard maps, and we are also conducting a workshop to create sensory maps. For people with sensory sensitivity, the way they feel differs greatly from person to person, such as ‘this light is really painful’ or ‘I just can’t stand this sound in this space. The ability to map such diverse sensory information not in chronological order, but from a bird’s eye view, is an appealing feature of tactile maps. It would be wonderful if we could create a more inclusive map that incorporates the various elements of the five senses. So, I would like to ask you what you think an “inclusive map” should look like. Please tell us about your ideal image.”
Dr. Watanabe: “Ideally, it would be ‘for everyone,’ but we still think it has to be made individually.”
Ishido: “In that sense, if a mechanism or technology is developed that allows people to create their own individually optimized maps, that in itself could lead to an inclusive map, wouldn’t it?”
Dr. Watanabe: “In reality, some people may say, ‘It is impossible to have individually optimized maps. It would be great if technology can cover that. For example, in Poland, there is a web application available that allows you to quickly create a map that you can touch, just like we do. There are many different types of maps, general maps and aerial photo maps of the same area, and one of them is a tactile map. That is what the map companies provide.
The tactile maps we are currently studying are mainly for blind people, but one student in my lab has created a tactile map for low-vision people. We simply made the background color blackish and the roads yellow or white, but we think it would be great if such a map could be offered as a tactile map or a map for low vision people along with, for example, default maps, aerial photo maps, bicycle maps, etc. in Google Maps.
By the way, I asked a researcher I know about the Polish service and it is probably provided free of charge. I think it is because they are profiting to some extent from the service of maps for the general public. It would be ideal to be able to operate free of charge like this.”
Ishido: “I feel that the idea of being able to make your own choices is a very inclusive concept. In some situations, you need this type of map, and in other situations, you want a map of a completely different shape. In this way, I deeply sympathized with the professor’s idea that a map that offers a wide range of choices according to individual situations and sensibilities is truly an inclusive map.
We have heard various stories, but in closing, I would like to ask you to give us a message you would like to convey toward the realization of a neuro-diverse society, based on your research on tactile maps and other studies.”
Dr. Watanabe: “I hope that technological advances will make it possible to create a society where things that used to be special can now be obtained in a very commonplace way. About 20 years ago, there were not so many people who looked at maps. Only a very few people who liked to look at them would buy them. Up until elementary, junior high, or high school, students were exposed to maps in class, but as soon as they graduated, only a few people who liked maps looked at them, while the rest of the population rarely looked at them. But with the advancement of technology such as the Web, smartphones, and GPS, there are now few people who don’t look at maps.
Nowadays, whether we are going to a store, meeting someone, or visiting a tourist spot, we are free to zoom in and out of large or small areas at will. However, what about the maps we touch? The lab doesn’t charge for making them, but it does take ‘about a week after you ask for them.
We hope that this will become available at least in a day or so. For example, the invasion of Ukraine was in the news every day, but it is frustrating for the visually impaired to not immediately know “where is Ukraine,” “how big is it,” and “what countries are around it.
We made that map and provided it to over 200 places. There are always people in the world who are interested. I think we should be working to make the tactile maps available to those people right away.”
Ishido: “I felt that individually optimized tactile maps that respond to the desire to know have great potential for the realization of a neuro-diverse society. I hope that our connection at “Brain World for Everyone” will be an opportunity for us to work together, including the dissemination of tactile maps. Thank you very much for your time today.”